kaggle_bike_sharing
import pandas as pd
import numpy as np
import matplotlib as mpl
import matplotlib.pyplot as plt
import seaborn as sns
from scipy import stats
%matplotlib inline
plt.style.use('ggplot')
mpl.rcParams['axes.unicode_minus'] = False
train = pd.read_csv("kaggle/train.csv", parse_dates=["datetime"])
train.shape
(10886, 12)
train.head()
| datetime | season | holiday | workingday | weather | temp | atemp | humidity | windspeed | casual | registered | count | |
|---|---|---|---|---|---|---|---|---|---|---|---|---|
| 0 | 2011-01-01 00:00:00 | 1 | 0 | 0 | 1 | 9.84 | 14.395 | 81 | 0.0 | 3 | 13 | 16 |
| 1 | 2011-01-01 01:00:00 | 1 | 0 | 0 | 1 | 9.02 | 13.635 | 80 | 0.0 | 8 | 32 | 40 |
| 2 | 2011-01-01 02:00:00 | 1 | 0 | 0 | 1 | 9.02 | 13.635 | 80 | 0.0 | 5 | 27 | 32 |
| 3 | 2011-01-01 03:00:00 | 1 | 0 | 0 | 1 | 9.84 | 14.395 | 75 | 0.0 | 3 | 10 | 13 |
| 4 | 2011-01-01 04:00:00 | 1 | 0 | 0 | 1 | 9.84 | 14.395 | 75 | 0.0 | 0 | 1 | 1 |
train.temp.describe()
count    10886.00000
mean        20.23086
std          7.79159
min          0.82000
25%         13.94000
50%         20.50000
75%         26.24000
max         41.00000
Name: temp, dtype: float64
train.isnull().sum()
datetime      0
season        0
holiday       0
workingday    0
weather       0
temp          0
atemp         0
humidity      0
windspeed     0
casual        0
registered    0
count         0
dtype: int64
dt = train["datetime"].dt
train["year"] = dt.year
train["month"] = dt.month
train["day"] = dt.day
train["hour"] = dt.hour
train["minute"] = dt.minute
train["second"] = dt.second
train.head()
| datetime | season | holiday | workingday | weather | temp | atemp | humidity | windspeed | casual | registered | count | year | month | day | hour | minute | second | |
|---|---|---|---|---|---|---|---|---|---|---|---|---|---|---|---|---|---|---|
| 0 | 2011-01-01 00:00:00 | 1 | 0 | 0 | 1 | 9.84 | 14.395 | 81 | 0.0 | 3 | 13 | 16 | 2011 | 1 | 1 | 0 | 0 | 0 |
| 1 | 2011-01-01 01:00:00 | 1 | 0 | 0 | 1 | 9.02 | 13.635 | 80 | 0.0 | 8 | 32 | 40 | 2011 | 1 | 1 | 1 | 0 | 0 |
| 2 | 2011-01-01 02:00:00 | 1 | 0 | 0 | 1 | 9.02 | 13.635 | 80 | 0.0 | 5 | 27 | 32 | 2011 | 1 | 1 | 2 | 0 | 0 |
| 3 | 2011-01-01 03:00:00 | 1 | 0 | 0 | 1 | 9.84 | 14.395 | 75 | 0.0 | 3 | 10 | 13 | 2011 | 1 | 1 | 3 | 0 | 0 |
| 4 | 2011-01-01 04:00:00 | 1 | 0 | 0 | 1 | 9.84 | 14.395 | 75 | 0.0 | 0 | 1 | 1 | 2011 | 1 | 1 | 4 | 0 | 0 |
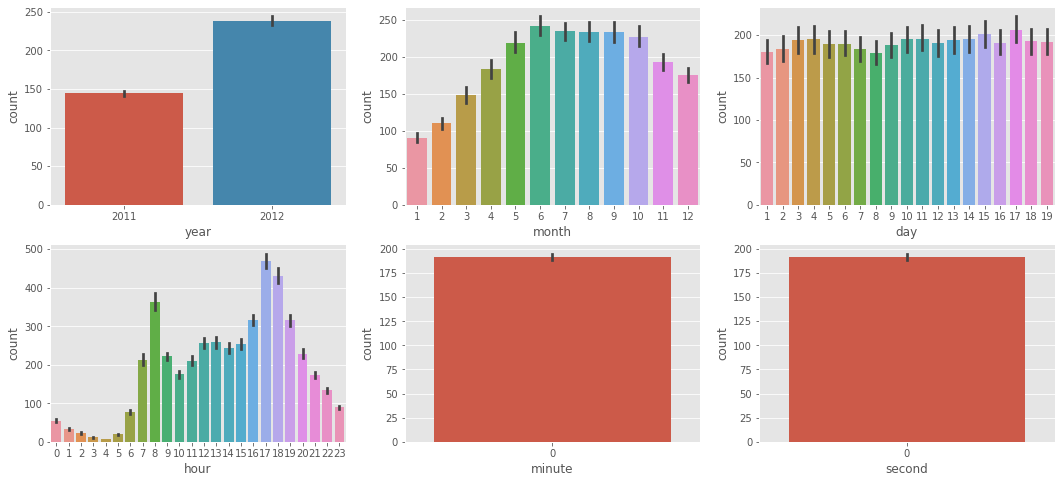
figure, ((ax1, ax2, ax3), (ax4, ax5, ax6)) = plt.subplots(nrows=2, ncols=3)
figure.set_size_inches(18,8)

sns.barplot(data=train, x="year", y="count", ax=ax1)
sns.barplot(data=train, x="month", y="count", ax=ax2)
sns.barplot(data=train, x="day", y="count", ax=ax3)
sns.barplot(data=train, x="hour", y="count", ax=ax4)
sns.barplot(data=train, x="minute", y="count", ax=ax5)
sns.barplot(data=train, x="second", y="count", ax=ax6)
<matplotlib.axes._subplots.AxesSubplot at 0x7f4e030fd310>